Table of Contents >> Show >> Hide
- First: What Inflation Are We Talking About?
- Why Inflation Expectations Matter (And Why the Fed Loses Sleep Over Them)
- Three Ways People “Forecast” Inflation (Without Owning a Crystal Ball)
- So… How Much More Inflation Are People Expecting?
- What Could Push Inflation Up (Or Help It Cool Down)?
- A Practical Way to Answer: “How Much More Inflation Are You Expecting?”
- Specific Examples: What “3% Inflation” Looks Like in Real Life
- How to Make Inflation Expectations Useful (Instead of Stressful)
- Experiences People Commonly Have When Inflation Is “Still Around” (Extra )
- Conclusion
If you’ve found yourself muttering, “How is a bag of groceries doing a high-jump routine over my budget?”you’re not alone. But here’s the twist: inflation isn’t just what prices did last month. It’s also what people expect prices to do next. And those expectations can shape the future in a very real way (yes, vibes can become math).
In this guide, we’ll translate inflation expectations into plain English, compare what consumers, professionals, and markets are “betting” on, and show you how to form a smart, non-panicky answer to the question: How much more inflation are you expecting?
First: What Inflation Are We Talking About?
“Inflation” gets used like it’s one universal number, but the U.S. has multiple major inflation gauges. The two most discussed are CPI (Consumer Price Index) and PCE (Personal Consumption Expenditures Price Index). They often move similarly, but they’re not identicaldifferent baskets, different weights, and different ways of handling some categories.
CPI: The “What Households Pay” Headliner
CPI is the big-name measure most people see on the news. It tracks price changes for a basket of goods and services typically purchased by urban consumers. When CPI cools, it often feels like the economic equivalent of seeing your phone battery at 30% instead of 5%: still not great, but at least you’re not sprinting to a charger.
PCE: The Fed’s Favorite Thermometer
PCE covers a broader set of spending and is the inflation measure the Federal Reserve typically emphasizes when it talks about its 2% inflation goal. PCE can differ from CPI because of scope and weighting differences (for example, the way medical spending is captured).
Translation: if two people weigh the same suitcase using different scales, you’ll get slightly different readingsbut it’s still the same suitcase. The trick is knowing which “scale” your audience is using.
Why Inflation Expectations Matter (And Why the Fed Loses Sleep Over Them)
Inflation expectations are basically the economy’s group chat prediction: “What do we think prices will do next?” If enough people expect higher inflation, they may act in ways that help produce itworkers push harder for wage increases, businesses raise prices sooner, and consumers buy earlier to avoid future price hikes. Expectations can become self-fulfilling.
The Federal Reserve cares a lot about expectations being “anchored” near its 2% goal. Anchored expectations make inflation easier to manage. Unanchored expectations are like driving on ice: you can turn the wheel, but outcomes get… creative.
Three Ways People “Forecast” Inflation (Without Owning a Crystal Ball)
1) Consumer Surveys: What Households Expect
Consumer surveys capture what everyday people think inflation will do. These can be influenced by what people notice most gas prices, rent, groceriesaka the stuff that shows up in your life like an uninvited guest.
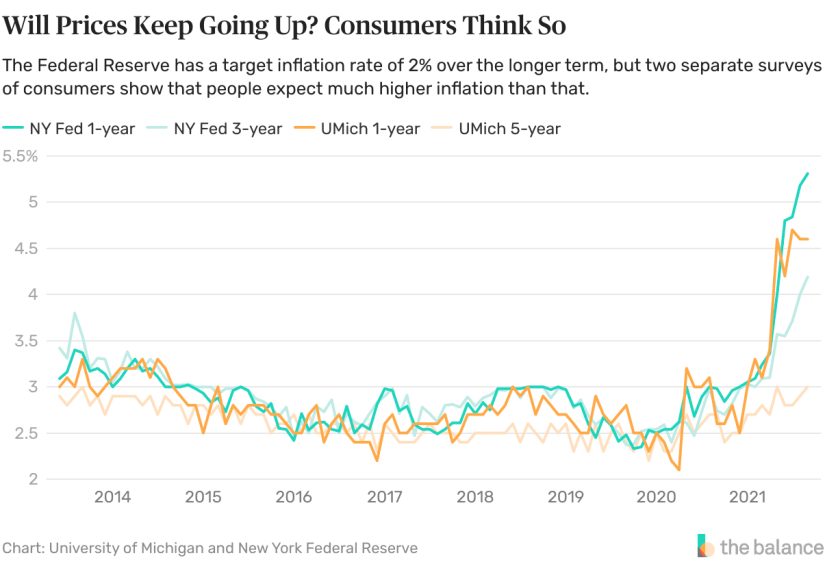
- University of Michigan Surveys of Consumers: often cited for 1-year and long-run expectations.
- New York Fed Survey of Consumer Expectations: reports expectations at 1-year, 3-year, and 5-year horizons.
2) Professional Forecasts: What Economists Expect
Professional forecasters tend to use more data, models, and assumptions (and fewer “the grocery bill felt wild last week” moments). A key source is the Philadelphia Fed’s Survey of Professional Forecasters (SPF).
3) Market-Based Measures: What Investors Are Pricing In
Markets provide “implied” inflation expectations using instruments like Treasury Inflation-Protected Securities (TIPS). A famous example is the breakeven inflation rate: the gap between yields on regular Treasuries and inflation-protected Treasuries.
Important caveat: market measures aren’t pure expectations. They can also reflect liquidity factors and inflation risk premiums. So think of them as “expectations + market seasoning,” not a perfectly clean number.
Bonus: Model Blends
Some institutions publish model-based measures that combine survey data and financial market data. The Cleveland Fed, for instance, produces estimates of expected inflation across different horizons.
So… How Much More Inflation Are People Expecting?
Let’s put the major “expectations voices” side by side. Notice how the answer depends on who you ask and how far out you look.
| Source | Horizon | What It’s Saying |
|---|---|---|
| University of Michigan (consumer survey) | 1-year ahead | Mid–3% range in early 2026 (recently reported around 3.4%). |
| University of Michigan (consumer survey) | Long-run | Just above 3% (recently reported around 3.3%). |
| NY Fed Survey of Consumer Expectations | 1-year ahead | Low–3% range (recently reported around 3.1%). |
| NY Fed Survey of Consumer Expectations | 3-year & 5-year ahead | About 3.0% in early 2026. |
| Federal Reserve (SEP projections) | 2026 (PCE inflation) | Mid–2% range (median projection around 2.4%). |
| Federal Reserve (SEP projections) | 2026 (core PCE) | Mid–2% range (median projection around 2.5%). |
| CBO (budget & economic outlook) | 2026 (PCE inflation) | High–2% range (around 2.7%). |
| Philadelphia Fed (SPF) | Long-run average | Low–2% range over the next decade (headline CPI around the mid–2% area; PCE lower). |
| Market-based (FRED breakevens) | Next 5 years | Mid–2% range recently (5-year breakeven around the mid–2% area). |
| Market-based (FRED 5y5y forward) | 5 years starting 5 years from now | Low–2% range recently (a “longer-run” market signal). |
If you’re wondering why consumers sound more worried than the Fed: households experience inflation in specific, high-frequency categories (rent, food, insurance), while central-bank projections focus on broader inflation trends and policy impacts over time. Both perspectives can be “right”they’re just answering slightly different questions.
What Could Push Inflation Up (Or Help It Cool Down)?
1) Housing and “Sticky” Services
Housing costs (especially rent-related components) have a reputation for cooling slowly. Even when inflation overall comes down, shelter and other services can stay stubborn. That’s why you may hear “inflation is easing” while your rent renews like it’s auditioning for a villain role.
2) Energy Shocks and Global Events
Energy prices can swing quickly, and those swings ripple into transportation and other costs. Even if energy isn’t the whole story, it can temporarily make inflation feel louderlike a drum solo in the middle of a quiet song.
3) Wages, Hiring, and Pricing Power
If wage growth stays strong and businesses feel they can keep passing costs through to customers, inflation can hang around. On the flip side, if demand cools and firms compete more on price, inflation tends to soften.
4) Policy and Trade Frictions
Changes in tariffs, supply chains, and global trade rules can nudge some prices higher (or lower), depending on the direction and scale. These effects aren’t always immediate, but they can add friction in certain product categories.
A Practical Way to Answer: “How Much More Inflation Are You Expecting?”
Here’s a simple, non-doomscrolling method. Pick the horizon first:
If You Mean “Over the Next 12 Months…”
Many consumer surveys in early 2026 point to inflation expectations around the low-to-mid 3% range. That suggests people expect inflation to continue, but not necessarily at the “everything is on fire” pace.
If You Mean “Over the Next Few Years…”
Medium-term survey expectations often hover around ~3%. Meanwhile, the Fed’s projections and many professional forecasts tend to sit closer to the mid-2% range, reflecting a view that inflation gradually moves nearer to the Fed’s longer-run goal.
If You Mean “Long-Run (5–10+ Years)…”
Long-run market-based measures and some professional forecasts commonly cluster in the low-2% range, while consumer long-run surveys can be a bit higher. This gap is normaland it’s one reason economists like to look at multiple measures at once.
A solid, evidence-based answer could sound like: “I’m expecting inflation to run around the low-to-mid 3% range over the next year, and closer to the mid-2% range over the longer rununless we get a big energy shock or housing stays extra sticky.”
Specific Examples: What “3% Inflation” Looks Like in Real Life
Inflation is a rate, not a one-time jump. If inflation runs ~3% for a year, a $100 weekly grocery basket becomes about $103 on average. If inflation runs ~3% for two years, you’re not at $106you’re closer to $106.09 because inflation compounds (yes, prices do math in their sleep).
The bigger issue is that not all prices rise evenly. If your biggest expenses are in categories that are rising faster than the average, your “personal inflation rate” can feel higher than the headline number.
How to Make Inflation Expectations Useful (Instead of Stressful)
- Separate “today’s inflation” from “expected inflation”: they’re related but not the same.
- Use at least two lenses: one survey-based and one market/pro forecast-based.
- Watch the categories that hit you most: rent, groceries, car insurance, utilities, transportation.
- Update your expectation quarterly, not hourly: inflation is a trend, not a jump scare.
And if you’re using expectations for decisions (budgets, pricing, long-term planning), aim for rangesnot one magic number. The future is uncertain; pretending otherwise is a hobby, not a strategy.
Experiences People Commonly Have When Inflation Is “Still Around” (Extra )
Even when inflation cools on paper, day-to-day life can feel like it’s still running hotbecause people experience inflation through routines. One common experience is “the grocery store drift.” You buy the same staplesbread, eggs, fruit, coffeeand the total inches up in a way that’s hard to notice item by item. It’s not always one giant price jump; it’s the slow accumulation of small increases across multiple trips. That’s why many people say, “I don’t care what the headline number ismy cart feels heavier.” The cart isn’t heavier, of course. The receipt is.
Another big one is “subscription fatigue.” Streaming, cloud storage, phone plans, gym membershipsservices often raise prices quietly, sometimes paired with a cheerful email about “improving your experience.” People start making micro-decisions: Do we actually use this? Is there a cheaper tier? Can we split a family plan? The inflation experience here isn’t dramatic; it’s administrative. Inflation turns you into an unwilling part-time auditor of your own life.
Housing is where inflation gets emotionally loud. Rent renewals can feel like a boss battle: you open the email, inhale deeply, and prepare for impact. Even homeowners feel it through insurance, maintenance, and property-related costs. When shelter costs rise faster than other prices, it changes the whole household budget storybecause housing isn’t optional. People respond by taking roommates longer than planned, delaying moves, negotiating renewals, or trading location for price. This is also where “expectations” form quickly: if your rent went up a lot last time, you’ll expect another punch next timeeven if overall inflation is easing.
Then there’s the “car-related surprise.” Gas might fall one month, but insurance or repairs jump the next. A routine oil change can turn into a comedy sketch where the mechanic says, “While we’re here…” and suddenly your budget is in a hostage situation. This creates a specific kind of inflation anxiety: not that all prices rise equally, but that any given month can bring a high-cost ambush.
Finally, many people report a mindset shift: they plan purchases differently. They stock up more when there’s a sale, compare stores more often, and delay big buys unless the timing feels right. It’s not panicit’s adaptation. In a world where inflation expectations sit above the Fed’s ideal target, people become more price-aware, more skeptical of “regular price,” and more motivated to hunt for value. The upside is smarter habits. The downside is you start remembering the price of everything, which is a strange superpower that nobody asked for.