Table of Contents >> Show >> Hide
- What Is the Slope of a Line?
- Why Slope Matters
- The Slope Formula
- How to Find the Slope from a Graph
- How to Find the Slope Using Two Points
- How to Find the Slope from an Equation
- Types of Slopes
- Slope and Parallel Lines
- Slope and Perpendicular Lines
- Real-Life Examples of Slope
- Common Mistakes When Finding Slope
- Quick Practice Problems
- How to Remember Slope
- Experience-Based Tips for Learning How to Find the Slope of a Line
- Conclusion
If algebra had a “how steep is this thing?” button, it would be called slope. The slope of a line tells you how much the line rises or falls as it moves from left to right. It is one of those math ideas that looks tiny on paper but shows up everywhere: road grades, ramps, staircases, graphs, business trends, speed, construction plans, and even that dramatic moment when your phone battery drops from 80% to 12% like it has somewhere better to be.
The good news? Learning how to find the slope of a line is much easier than it may seem. Once you understand “rise over run,” the slope formula, and how to spot slope in an equation, the whole topic starts to feel less like a mystery and more like a recipe. And unlike some recipes, this one does not require you to “fold gently” or pretend you know what “al dente” means.
In this easy guide, we will break down what slope means, how to calculate slope from a graph, how to find slope using two points, how to read slope from an equation, and how to avoid common mistakes. You will also get practical examples, quick checks, and real-life ways to think about slope so it actually sticks.
What Is the Slope of a Line?
The slope of a line is a number that describes the line’s steepness and direction. In simple terms, slope tells you how much the y-value changes when the x-value changes.
The most common way to describe slope is:
Slope = rise ÷ run
The “rise” is the vertical change, or how far the line moves up or down. The “run” is the horizontal change, or how far the line moves left or right. On a coordinate plane, that means slope compares the change in y to the change in x.
Mathematically, slope is often represented by the letter m:
m = change in y ÷ change in x
If a line climbs upward as it moves from left to right, the slope is positive. If it falls downward as it moves from left to right, the slope is negative. If the line is perfectly flat, the slope is zero. If the line is vertical, the slope is undefined because you would have to divide by zero, and math politely refuses to do that.
Why Slope Matters
Slope is not just a classroom exercise. It is a way to measure rates of change. When you understand slope, you can understand how one quantity changes compared with another.
For example, if a car travels 180 miles in 3 hours, the slope of a distance-time graph would show the car’s speed: 60 miles per hour. If a company earns more revenue each month, the slope of a revenue graph shows how quickly that revenue is increasing. If a hiking trail rises 500 feet over a horizontal distance of 2,000 feet, slope helps describe how steep the trail is. Your legs may describe it with stronger language, but slope keeps things mathematical.
The Slope Formula
When you know two points on a line, you can use the slope formula:
m = (y₂ – y₁) ÷ (x₂ – x₁)
The two points are usually written as:
(x₁, y₁) and (x₂, y₂)
This formula means you subtract the y-values, subtract the x-values in the same order, and divide the results.
Important Rule: Keep the Order Consistent
The most common mistake when using the slope formula is mixing up the order. If you start with y₂ – y₁ on top, you must also use x₂ – x₁ on the bottom. Do not switch directions halfway through like a GPS recalculating in panic mode.
For example, if your two points are (2, 3) and (6, 11), you can label them:
(x₁, y₁) = (2, 3)
(x₂, y₂) = (6, 11)
Now plug the values into the formula:
m = (11 – 3) ÷ (6 – 2)
m = 8 ÷ 4
m = 2
The slope is 2. That means for every 1 unit the line moves to the right, it rises 2 units.
How to Find the Slope from a Graph
Finding slope from a graph is often the easiest method because you can literally see the rise and run. The trick is to choose two clear points on the line, preferably points where the line crosses grid intersections.
Step-by-Step Method
First, choose two points on the line. Second, count how far you move vertically from the first point to the second point. That is the rise. Third, count how far you move horizontally. That is the run. Finally, write the ratio as rise over run and simplify if possible.
Imagine a line passes through the points (1, 2) and (4, 8). Start at (1, 2). To reach (4, 8), you move up 6 units and right 3 units.
Slope = rise ÷ run = 6 ÷ 3 = 2
So the slope is 2.
What If the Line Goes Down?
If the line goes downward from left to right, the slope is negative. For example, suppose a line passes through (0, 5) and (3, -1). The line moves down 6 units and right 3 units.
Slope = -6 ÷ 3 = -2
The slope is -2. A negative slope tells you the line decreases as x increases.
How to Find the Slope Using Two Points
Sometimes you are not given a graph. You may only have two points. That is when the slope formula becomes your best friend, or at least a reliable coworker who always labels their spreadsheets correctly.
Example 1: Positive Slope
Find the slope of the line passing through (3, 4) and (7, 12).
Use the formula:
m = (y₂ – y₁) ÷ (x₂ – x₁)
Substitute the values:
m = (12 – 4) ÷ (7 – 3)
m = 8 ÷ 4
m = 2
The slope is 2.
Example 2: Negative Slope
Find the slope of the line passing through (-2, 9) and (4, -3).
m = (-3 – 9) ÷ (4 – (-2))
m = -12 ÷ 6
m = -2
The slope is -2. The line falls as it moves from left to right.
Example 3: Fractional Slope
Find the slope of the line passing through (1, 2) and (5, 5).
m = (5 – 2) ÷ (5 – 1)
m = 3 ÷ 4
m = 3/4
The slope is 3/4. That means the line rises 3 units for every 4 units it moves to the right.
How to Find the Slope from an Equation
When a line is written in slope-intercept form, finding the slope is delightfully simple. The slope-intercept form is:
y = mx + b
In this equation, m is the slope and b is the y-intercept. The y-intercept is the point where the line crosses the y-axis.
Example: Slope-Intercept Form
Find the slope of this line:
y = 5x + 2
The number in front of x is 5, so the slope is 5.
Now try this one:
y = -3x + 7
The slope is -3.
And this one:
y = (1/2)x – 4
The slope is 1/2.
What If the Equation Is Not in Slope-Intercept Form?
If the equation is not written as y = mx + b, solve for y first. Once y is alone on one side, the coefficient of x is the slope.
For example:
2x + y = 9
Subtract 2x from both sides:
y = -2x + 9
Now the equation is in slope-intercept form, so the slope is -2.
Types of Slopes
Not all slopes behave the same way. Some rise, some fall, some lie flat, and some stand straight up like they are refusing to participate.
Positive Slope
A line with a positive slope rises from left to right. For example, m = 4 means the line increases quickly. A smaller positive slope, such as m = 1/3, still rises, but more gently.
Negative Slope
A line with a negative slope falls from left to right. For example, m = -2 means the line drops 2 units for every 1 unit it moves to the right.
Zero Slope
A horizontal line has a slope of zero. This happens because the y-values do not change. For example, every point on the line y = 6 has the same y-value, so the rise is 0.
Slope = 0 ÷ run = 0
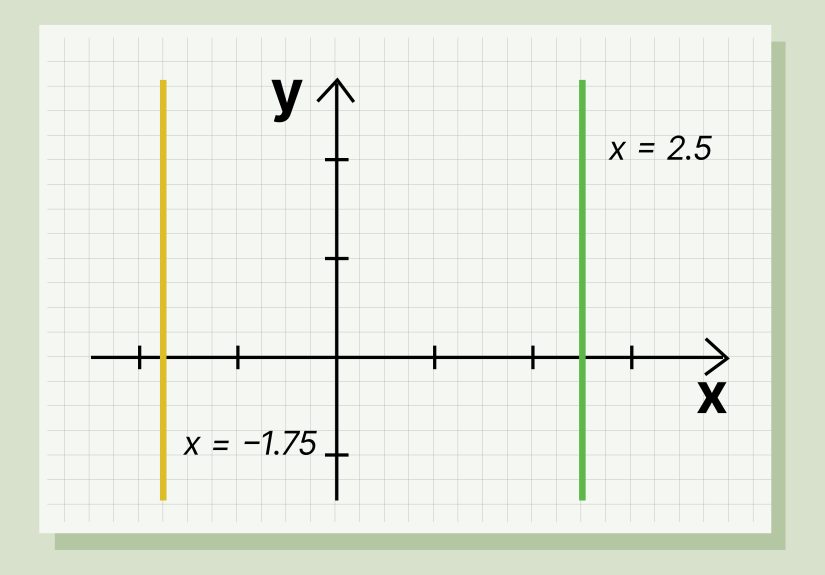
Undefined Slope
A vertical line has an undefined slope. This happens because the x-values do not change, so the run is 0. Since division by zero is undefined, the slope is undefined.
For example, the line x = 4 is vertical, so its slope is undefined.
Slope and Parallel Lines
Parallel lines have the same slope. They travel in the same direction and never meet, no matter how far you extend them. Think of train tracks, except safer and less dramatic.
If one line has a slope of 3, any line parallel to it also has a slope of 3. The y-intercept may be different, but the steepness is the same.
Slope and Perpendicular Lines
Perpendicular lines meet at a right angle. Their slopes are negative reciprocals of each other. That means you flip the fraction and change the sign.
If one line has a slope of 2, write it as 2/1. Flip it to get 1/2, then change the sign. The perpendicular slope is -1/2.
If one line has a slope of -3/4, the perpendicular slope is 4/3.
Real-Life Examples of Slope
Slope appears whenever one thing changes in relation to another. In everyday life, it can describe steepness, speed, growth, or decline.
Roads and Ramps
A ramp’s slope tells you how steep it is. A gentle ramp has a small slope, while a steep ramp has a larger slope. This matters in architecture, accessibility design, and construction because ramps need to be safe and usable.
Speed and Motion
On a distance-time graph, slope represents speed. If the graph rises quickly, the object is moving fast. If the graph is flat, the object is not moving. If the graph goes backward, you may be watching a very confusing road trip.
Business and Data
In business, slope can show how quickly sales, costs, or profits change over time. A positive slope on a sales graph usually means growth. A negative slope may mean sales are falling and someone in the meeting is about to say “circle back.”
Common Mistakes When Finding Slope
Even when the idea is simple, little errors can sneak in. Here are the most common slope mistakes and how to avoid them.
Mistake 1: Reversing Rise and Run
Slope is rise over run, not run over rise. The vertical change goes on top, and the horizontal change goes on the bottom.
Mistake 2: Mixing Up Point Order
When using the slope formula, keep the subtraction order consistent. If you subtract the second y-value minus the first y-value, do the same with the x-values.
Mistake 3: Forgetting Negative Signs
Negative numbers can change the whole answer. Be especially careful when subtracting a negative number, such as 4 – (-2). That becomes 6, not 2.
Mistake 4: Calling Vertical Slope Zero
Horizontal lines have zero slope. Vertical lines have undefined slope. A quick memory trick: a flat road has zero steepness, but a straight-up wall is not a road at all.
Quick Practice Problems
Problem 1
Find the slope between (2, 5) and (6, 13).
m = (13 – 5) ÷ (6 – 2) = 8 ÷ 4 = 2
The slope is 2.
Problem 2
Find the slope between (-1, 4) and (3, -4).
m = (-4 – 4) ÷ (3 – (-1)) = -8 ÷ 4 = -2
The slope is -2.
Problem 3
Find the slope of y = 7x – 10.
The equation is in slope-intercept form, so the slope is 7.
Problem 4
Find the slope of the line x = -2.
This is a vertical line, so the slope is undefined.
How to Remember Slope
The easiest way to remember slope is the phrase rise over run. Rise means vertical movement. Run means horizontal movement. Put rise on top and run on the bottom.
You can also remember the formula as:
m = y change ÷ x change
Or, if you like the official-looking version:
m = (y₂ – y₁) ÷ (x₂ – x₁)
The formula may look fancy, but it is just comparing how much y changes to how much x changes. That is the entire plot twist.
Experience-Based Tips for Learning How to Find the Slope of a Line
One of the best ways to learn slope is to stop treating it like a random formula and start treating it like a story of movement. Every line is going somewhere. It rises, falls, stays flat, or stands vertically. When students try to memorize slope without visualizing movement, they often get stuck. But when they picture a person walking along the line from left to right, the meaning becomes clearer. If the person is walking uphill, the slope is positive. If the person is walking downhill, the slope is negative. If the person is walking across a flat sidewalk, the slope is zero. If the person is trying to walk straight up a wall, the slope is undefinedand that person may need a ladder and better life choices.
A helpful learning habit is to say the movement out loud. For example, look at two points and say, “up 4, right 2,” then write 4/2. If the movement is “down 3, right 5,” write -3/5. Speaking the rise and run makes it easier to connect the graph to the numbers. This is especially useful for visual learners because slope becomes less abstract and more physical.
Another useful experience-based tip is to draw a small slope triangle on the graph. Choose two clean points on the line, then draw a vertical segment for the rise and a horizontal segment for the run. This little right triangle acts like a slope detector. It shows exactly where the numbers come from. Many mistakes happen because students try to guess the slope just by staring at the line. A slope triangle removes the guesswork.
When using the slope formula, it helps to organize your work in columns. Write the two points one above the other, then subtract vertically. For example, with (2, 3) and (8, 15), subtract the y-values first: 15 – 3 = 12. Then subtract the x-values: 8 – 2 = 6. Finally, divide: 12/6 = 2. This method keeps the order consistent and prevents the classic mistake of subtracting one direction on top and the opposite direction on the bottom.
It is also smart to estimate before calculating. If a line clearly rises from left to right, your answer should be positive. If your calculation gives a negative number, check your signs. If a line is almost flat, the slope should be close to zero. If your answer is 25, something probably went sideways. Estimation is like a math seat belt: it does not solve the problem for you, but it can stop a crash from getting worse.
Practice with real-life examples can make slope feel less like homework. Look at a staircase and think about rise and run. Look at a ramp outside a building. Look at a line graph showing temperature changes during the day. Even a phone battery graph can show slope. A slow battery drain has a gentle negative slope. A sudden battery drop has a steep negative slope, usually right before you need directions, a ride, or proof that you did, in fact, pay for parking.
Finally, remember that slope is not about making math harder. It is about describing change clearly. Once you can find slope from a graph, two points, or an equation, you have a powerful tool for understanding lines and linear relationships. The more examples you work through, the more automatic it becomes. At first, slope may feel like another algebra rule to memorize. With practice, it becomes a simple question: “How much does y change when x changes?” Answer that, and you have found the slope.
Conclusion
Learning how to find the slope of a line is one of the most useful skills in algebra. Slope tells you the steepness and direction of a line, and it can be found in several ways. From a graph, count the rise and run. From two points, use the slope formula. From an equation in slope-intercept form, identify the coefficient of x. Once you understand these methods, slope becomes much easier to recognize and calculate.
Remember the key idea: slope is the change in y divided by the change in x. Positive slopes rise, negative slopes fall, horizontal lines have zero slope, and vertical lines have undefined slope. Whether you are solving homework problems, reading graphs, analyzing data, or figuring out why a ramp feels like a mountain, slope gives you a simple language for measuring change.
Note: This article is written for educational use and synthesizes standard algebra concepts commonly taught in U.S. math courses, including rise over run, the slope formula, slope-intercept form, and real-world slope applications.